
Reimagining Gift Card Analytics with AI
A UX Case Study: Transforming how clients monitor customer gift card transactions through AI-powered insights and role-based dashboards.
Company
Pine Labs Prepaid
Role
UX Design & Strategy
2 Weeks
Platform
Desktop
Team
1 Designer · 1 Product Manager · 4+ Engineers · Business
Overview
Pine Labs provides a gift card and loyalty platform used by enterprise retailers like Landmark Group to monitor customer gift card transactions. The existing analytics dashboard (Qwik Admin) served basic reporting needs but relied heavily on manual data interpretation.
Users had to navigate multiple dashboard tabs to piece together insights. The redesign introduced AI-powered intelligence, role-based views, and natural language querying to transform how clients interact with their transaction data.
Problem Statement
01
Data Overload Without Context
Clients faced dashboards packed with raw numbers but no narrative explaining what these numbers actually meant or why trends occurred.
02
One-Size-Fits-All View
Whether an analyst digging into individual rows or a busy manager looking for high-level summaries, everyone saw the same rigid dashboard layout.
03
Manual Report Generation
Getting specific transactional reports required navigating through complex filters, exporting CSVs, and doing manual calculations in Excel.
04
Slow Time-to-Insight
Users spent an average of 15 to 20 minutes piecing together operational insights from multiple disconnected dashboard tabs.
Goals and Objectives
01
Reduce time-to-insight from 15+ minutes to under 60 seconds with AI-generated summaries.
02
Introduce role-based views (Analyst vs Manager) so each user sees data at the right depth.
03
Enable natural language querying so clients can ask for specific reports in plain English.
Design Process
1
Research and Audit
Audited the legacy platform & mapped user friction points.
2
User Interviews
Spoke to 12 risk analysts and store managers.
3
Information Architecture
Restructured Qwik Admin around streamlined intent-driven actions.
4
UI Design & Prototyping
Designed robust dashboards & standard conversational models.
Testing & Iteration
Tested prototypes with clients to refine clarity & AI confidence.
Solution
KPI cARDS
BEFORE

Raw metrics only with year-over-year percentages, no interpretation. Risk warning flags required manual computation.
AFTER

AI Insights badge on each card with contextual summaries. E.g., '14% spike in gift card activations driven primarily by the Landmark Group weekend promotional event.'
DASHBOARD VIEWS
BEFORE
Single rigid view for all user roles, same charts for everyone. Overwhelmed managers and under-served analytical risk teams.
AFTER

Analyst View toggle that expands to show additional metrics, live server streams, and dual chart layouts specifically designed for transaction auditing.
rEPORTING
BEFORE
Manual filter-based navigation through multiple nested Data Export tabs. Slow spreadsheet exports to gather simple information.
AFTER
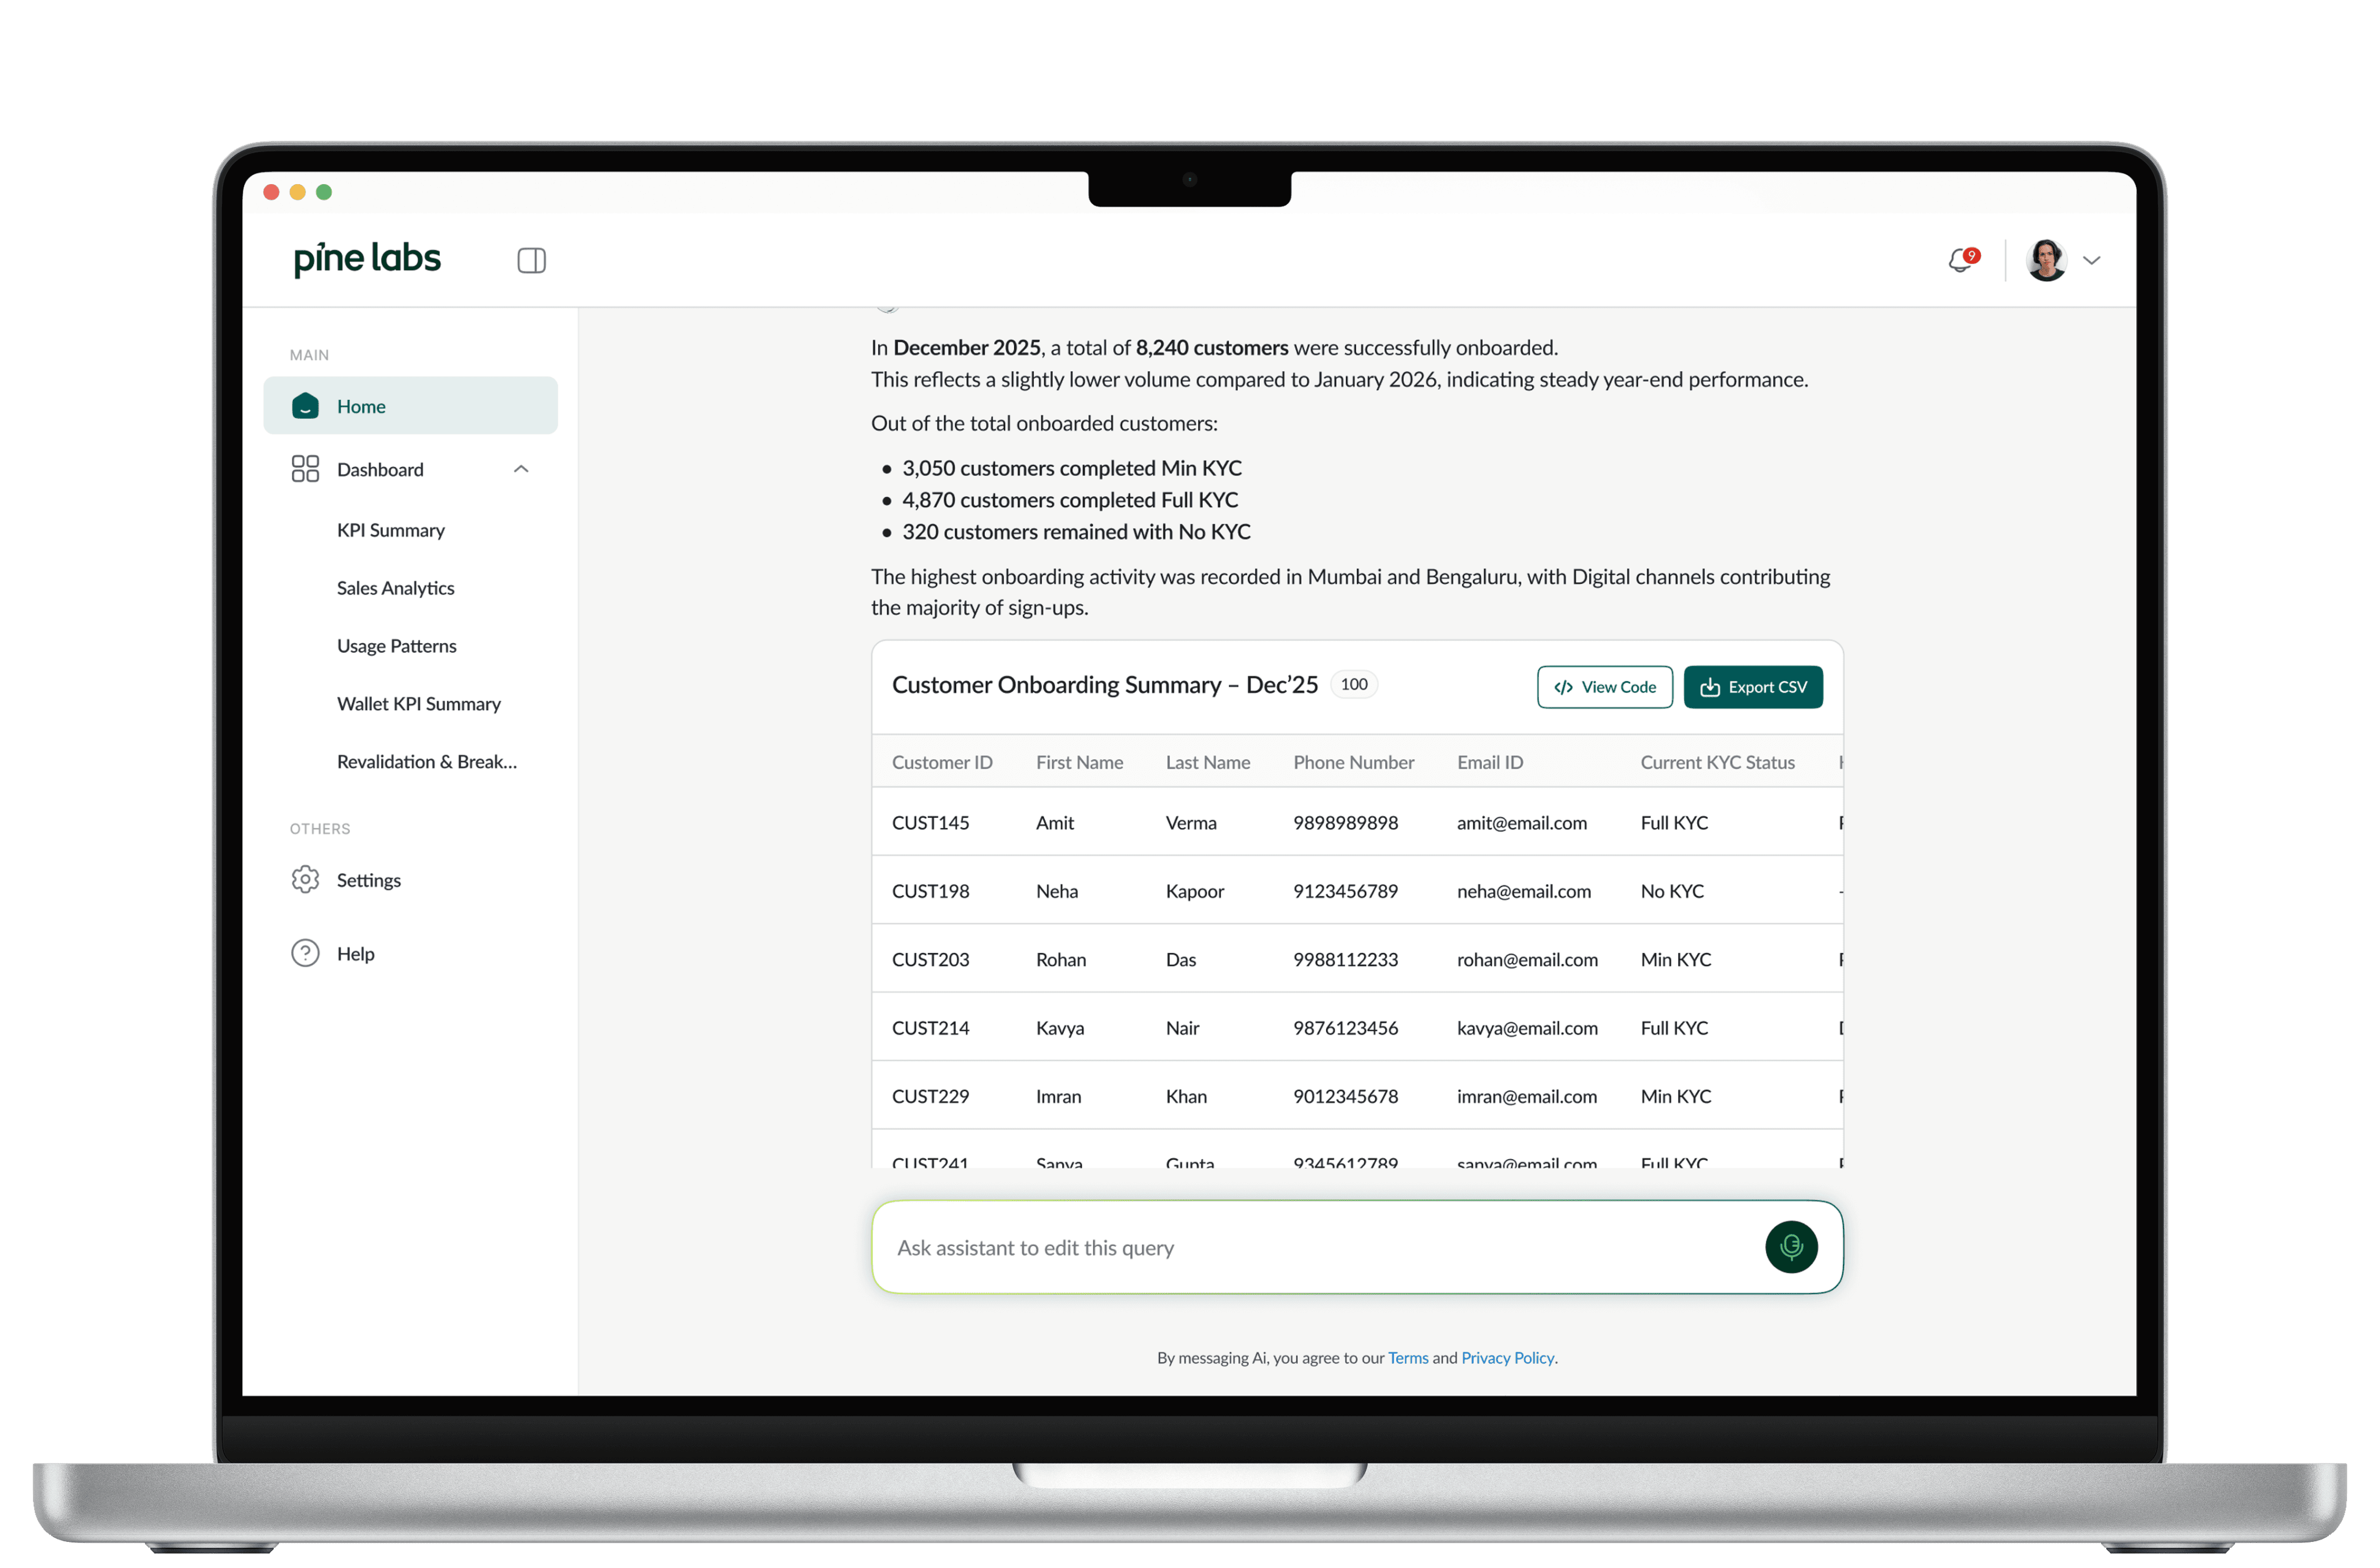
AI-powered NLP interface where users type questions in plain English and get instant structured responses with pre-compiled data tables.
Natural Language Reporting
The AI-powered conversational interface serves as the centerpiece of the redesign. Users land on a personalized dashboard featuring popular queries, making adoption effortless.
Typing complex questions returns immediate data summaries, structured tables, and download links, with the AI clarifying ambiguous queries gracefully.

Impact and Results
85%
Reduction in time-to-insight for store managers.
3x
Faster overall report generation with AI Conversational model.
40%
Fewer support tickets submitted for custom data exports.
92%
User satisfaction score recorded during beta testing.
Key Learnings
01
Context Over Raw Data
AI summaries must add meaningful, actionable context rather than simply restating numbers that are already visible on the screen.
02
Integrated Toggles
Role-based views are highly effective when implemented as a simple on-screen toggle rather than separate, siloed dashboards.
03
Suggested Queries
Pre-populated and suggested queries are critical to drive adoption and teach users how to query the conversational assistant.
04
Handle Ambiguity
Conversational interfaces must handle user ambiguity gracefully by politely clarifying which dataset or timeline they mean.
Looking Ahead
The redesigned platform transforms gift card monitoring from a manual, data-heavy process into an intelligent, conversational experience. By putting AI at the core, we have set a new benchmark for how Pine Labs B2B products handle analytics.
The next phase of the project will focus on introducing predictive analytics, automated anomaly detection, and expanded NLP capabilities across the entire Pine Labs suite.